Add a Refresh Time Stamp To Your Power BI Reports

It is often useful to tell your users when the report refreshed so they have some idea of how current, or stale, the data is. Unfortunately, you cannot just add a TODAY() formula to your report as that will change each time they open the report. This method will give you the refresh time stamp and compensate for Daylight Savings Time.

First, let’s get the time and date in Power Query. This time will only change on the report refresh, which is what you want.

  1. Open Power Query. You can do this using Get Data on the main Power BI menu, and we want a Blank Query.

  2. Click on Advanced Editor on the Home ribbon of Power Query.

  3. Remove the default text.

  4. Replace it with this code

let
    Source = Table.FromRows(Json.Document(Binary.Decompress(Binary.FromText("VZDLCQAhDAV78Sxonv9axP7bWLNPMN4mDMYhc7oUBAFRmvNOJBTy8r8RnTpNJh8TdRo0iUzT94BIIeTzRBdAaBr5GF0A0FTyMZqGdNM2mwDkG7CZZuhQKEA2ZdWI+pQ1U9ae/7v5v9vTYNzTYNiyFG/Z5rU+", BinaryEncoding.Base64), Compression.Deflate)), let _t = ((type nullable text) meta [Serialized.Text = true]) in type table [dtDSTStart = _t, dtDSTEnd = _t]),
    #"Changed Type" = Table.TransformColumnTypes(Source, {{"dtDSTStart", type date}, {"dtDSTEnd", type date}}, "en-US"),
    varCurrentDate = DateTime.Date(DateTimeZone.SwitchZone(DateTimeZone.LocalNow(),-8)),
    #"Filtered Rows" = Table.SelectRows(#"Changed Type", each [dtDSTStart] < varCurrentDate and [dtDSTEnd] > varCurrentDate),
    varDSTOffset = Table.RowCount(#"Filtered Rows"),
    #"Last Refresh Date" = #table(
        type table
            [
                #"RefreshDate"=datetimezone
            ],
        {
            {DateTimeZone.SwitchZone(DateTimeZone.LocalNow(),-8 + varDSTOffset,0)}
        }
        )
in
    #"Last Refresh Date"

Wow. What is all of that? Just to get a refresh timestamp? Yes. Let’s look at the steps.

Source: This is the Daylight Savings Time Start and End dates for the US. You will need to change this for your region as applicable. This goes through 2030 right now, and is subject to change at the whims of politicians.

You can manually edit this table by clicking on the gear icon in the Source step.

You can also get rid of all of that and point the source to a table you have somewhere. A table on your SQL server, a SharePoint List, Excel File, whatever. Swapping out the code for that is beyond the scope of this article. I wanted to provide a complete solution in one query without having to rely on external data sources. I know there are websites with this data you can link to, but I don’t like relying on websites for my reports, and don’t want to add those sites to my on-prem gateway just for a DST table.

Changed Type: This just changes the data keyed in the Source line to dates. It is always text by default. Those are in the US Date format and I told Power Query to use the en-US culture setting to do the type conversion.

varCurrentDate: This gets today’s date, with an offset for my UTC timezone, which is -8 - Pacific Time. You’d need to use Google for yours, or use this handy article on Wikipedia. You can use a decimal number here, so if you are in the Marquesas Islands, your offset is -9:30, which means you would use -9.5 here.

Filtered Rows: This will return 1 or 0 rows when the varCurrentDate variable is greater than the Start Date and less than the End Date for when DST occurs.

varDSTOffset: This is a variable that counts the rows returned in the Filtered Rows step. It is either 1 or 0. This will add 1 or 0 hrs to the time calculated next, adjusting for DST.

Last Refresh Date: This uses the formula below to get the current date and time of the refresh, adjusting for the varDSTOffset calculated above. It then puts it into a table and changes the type to “datetimezone” so it can actually be loaded into the DAX data model. Note, again, you’ll need to adjust that -8 to your UTC offset.

=DateTimeZone.SwitchZone(DateTimeZone.LocalNow(),-8 + varDSTOffset,0)

The final result is a date with a timezone offset that looks like this. Remember, I am in the -8 Pacific Timezone, and DST is in effect, so it added 1, making the net UTC Offset -7.

Note: If you do not observe DST in your area, just remove the +varDSTOffset part of the formula. You can also remove about 90% of this code, but I’ll leave that to you. Leaving the DST code in and removing varDSTOffset from your formula will not impact performance at all.

The DAX model will understand that and will adjust the time shown to the user. Finally, rename the query to “Refresh Time Stamp” and make sure it is set to load. Close Power BI and apply changes.

In DAX, create a new measure:

Last Update = 
     "Last Update on " 
     & UNICHAR(10) 
     & FORMAT(
         MAX('Refresh Time Stamp'[RefreshDate]),
         "MMM DD, YYYY H:MM AM/PM"
     )

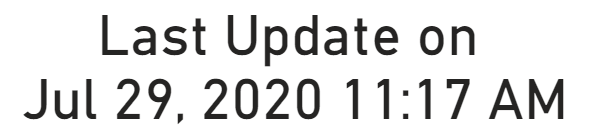
Now drop that measure in to card. It will look something like this:

Resize and position the card as desired. If you do not like the forced line feed before the date, get rid of the UNICHAR(10) function. You can also customize the format of the time shown using the codes from this article by MIcrosoft.

Finally, to you can right-click on the Refresh Time Stamp table in Power BI and hide it. The measure will still work, but the table won’t clutter up your list of measures, tables, and fields.

One final bit of minutia. The varCurrentDate variable itself does not adjust itself for DST, so if your report runs between midnight and 3am on the day DST switches, it may be off one hour for that refresh. It will adjust though if it is run after the 3am switch.

Return Row Based on Max Value From One Column when Grouping

When you group data in Power Query, you are able to do a number of aggregations, like count, sum, min, max, etc. The problem is each of those aggregations only operate on that column. Let me show you what I mean. Suppose you have this data:

The Data

The Data

You need to return a table to the DAX model (or an Excel table) that only has one record per product, and you want the latest date, and the sales person associated with that date. So for product A, it is June 18, 2020 and Suresh, for B it is June 14, 2020 and Ana, and so on.

The Goal

The Goal

If you do a Group By in Power Query and group on the product, then select the Max aggregation for the date and sales person, with the Group By dialog box configured as shown below, you get the following table:

20200715 - Incorrect Grouping.png

The first row is correct, but that is just a coincidence. The max value for that row for product A is “Suresh” because that is alphabetically the highest name, starting with the letter S. The second row though you can see is wrong. It picked up Sally, the last name alphabetically in the Sales Person column. Sally is not associated with the June 14 record though, Ana is.

So, how do we fix this? There are two ways. Let’s do the long way. First, change the group by dialog box by removing the Max aggregation for the name and replace it with the All Rows aggregation as shown. It will return a new column called “All Rows” that has a nested table.

20200715 - Correct Grouping.png

Looking at the image below, if you click to the right of the word Table you can see at the bottom of your screen the contents of that field. Do not click directly on the word Table itself as that will cause the table to expand. If you do that, just delete the last step Power Query generated to get back to this view. You can see below it has all 3 sales records for product B, and we want to return Ana.

20200715 - All Rows Table Contents.png

You need to add a new column at this point, so go to the Add Columns tab and add a new column. Enter this formula:

= Table.Max([All Rows], "Sale Date")

Table.Max will take the table you give it, which is [All Rows] in this case, and return the record that has the maximum value for the field you specify, which is “Sale Date'“. You now have a new column that will have the word Record in yellow. You can see the formula at location 1 below. If you click to the right of it on the Product B row (2), at the bottom of the screen you will see it returned the June 14 record and has Ana’s name (3). We are getting there!

20200715 - the Table Max Result.png

Now just click the Expansion icon in the upper right of the “Max Record” field and select Sales Person.

20200715 - Table Max almost final.png

Now each product record has the correct sales person that corresponds to the latest sales date. At this point, just remove the All Rows column and change the data type of Sales Person to text.

But that is 6 steps. Why can’t we do this in a single grouping step and radically cut down all of the extra steps? We can! But that requires a bit of manual M code. Let’s see how that works. First, let’s take a look at the entire M code for what we just did through the expansion of the final record:

20200715 - M Code Before Tweaking.png

You can ignore the Source line. That is just how Power Query stores data when you use the Enter Data function. I pasted the data in from Excel vs linking directly to Excel so I could share the PBIX file with at the bottom of this post.

The second step is “Grouped Rows” and I’ve circled that in Red. I added a lot of line feeds and indentation to make it easier to read. Remember, it isn’t M code unless it is formatted. What we are interested in is what starts on line 9 that is marked “All Rows.” This is how that nested table gets built. We don’t want the nested table though. We just need someone’s name. So, that little bit of code is as shown below:

{"All Rows", each _, type table [Product=nullable text, Sale Date=nullable text, Sales Person=nullable text]}

What this is doing is saying for each “_” return a table. What does that mean though, the “each _” part? Well, if you want to do a deep dive, you can read more about that at Ken Puls site. For our purposes, the _ character is a temporary variable that stores the entire table for for the current grouping being passed by the Table.Group function, which is at the Product field level. It is the same as:

{"All Rows", each _}

The rest of the statement is just classifying the table fields. If you want to go down that rabbit hole, be my guest. You will see though that we don’t need that table formatting. What we want to do is take that temporary _ variable with our table in it, and return the right sales person for the maximum date. All we have to do is wrap the variable with Table.Max, as follows:

{"All Rows", each Table.Max(_, "Sale Date"), type table [Product=nullable text, Sale Date=nullable text, Sales Person=nullable text]}

Now, instead of a nested table, we’ve jumped straight to the single record we want within the Table.Group function, as shown below. Now we just need to get the sales person’s name.

20200715 - M Code 02 with Table Max Record Showing.png

To get a single value from a field in a record, just append the field name in square brackets, as follows:

{"All Rows", each Table.Max(_, "Sale Date")[Sales Person], type table [Product=nullable text, Sale Date=nullable text, Sales Person=nullable text]}

Our final tweak will be to rename the “All Rows” field to “Sales Person”, then get rid of the table format code. That leaves you with this very short statement below. You’ll notice that instead of the type table with the field formatting, I told it to just set this value to text.

{"Sales Person", each Table.Max(_, "Sale Date")[Sales Person], type text}

20200715 - Final Result - Just Needs Data Type.png

That’s it. The table above is what is returned, and you’ll see that Ana was properly returned for product B. Just set the Sales Person data type to text, and you are done. The full M code is below. You’ll notice that there are only two steps here, the Source step, and the Table.Group step.

20200715 - Final M Code.png

The beauty of this is, let’s say you have four columns you need to pull out this way, perhaps including the sales person’s last name, the region, and their commission rate. With the long method above, you have to add a new column with the Table.Max function, then extract the field you need, then expand the record for each one. You’d be well over 20 steps for the entire query.

With this method, you just keep adding columns to the Table.Group function, like this:

{"Last Name", each Table.Max(_, "Sale Date")[Last Name] type text},
{"Region", each Table.Max(_, "Sale Date")[Sales Region] type text},
{"Commission Rate", each Table.Max(_, "Sale Date")[Commission Rate], Percentage.Type}

That is still just two steps! I have confirmed this runs much faster than the multiple step process. I came up with this when I had a 20K record table that I thought was taking way too long to finish. This updated method took a fraction of the time, it just required a bit of work on my part.

I hope that helps you. The entire example can be found in this PBIX file.